Learning Points: Scaling Monitoring from Prometheus to M3
I enjoy watching 45 minutes to 1 hour long technical talks at conferences. Unfortunately, I am not retaining the knowledge as long as I would like to. From now on, I am going to try summarizing my takeaways for each videos to improve my own retention.
This video is about scaling monitoring from Prometheus to M3 at Databricks presented by YY Wan and Nick Lanham.
Context
Prometheus based monitoring system is used in Databricks since 2016. Most internal services run on Kubernetes and Spark workloads run in VMs in customer environments. PromQL is widely used by engineers.
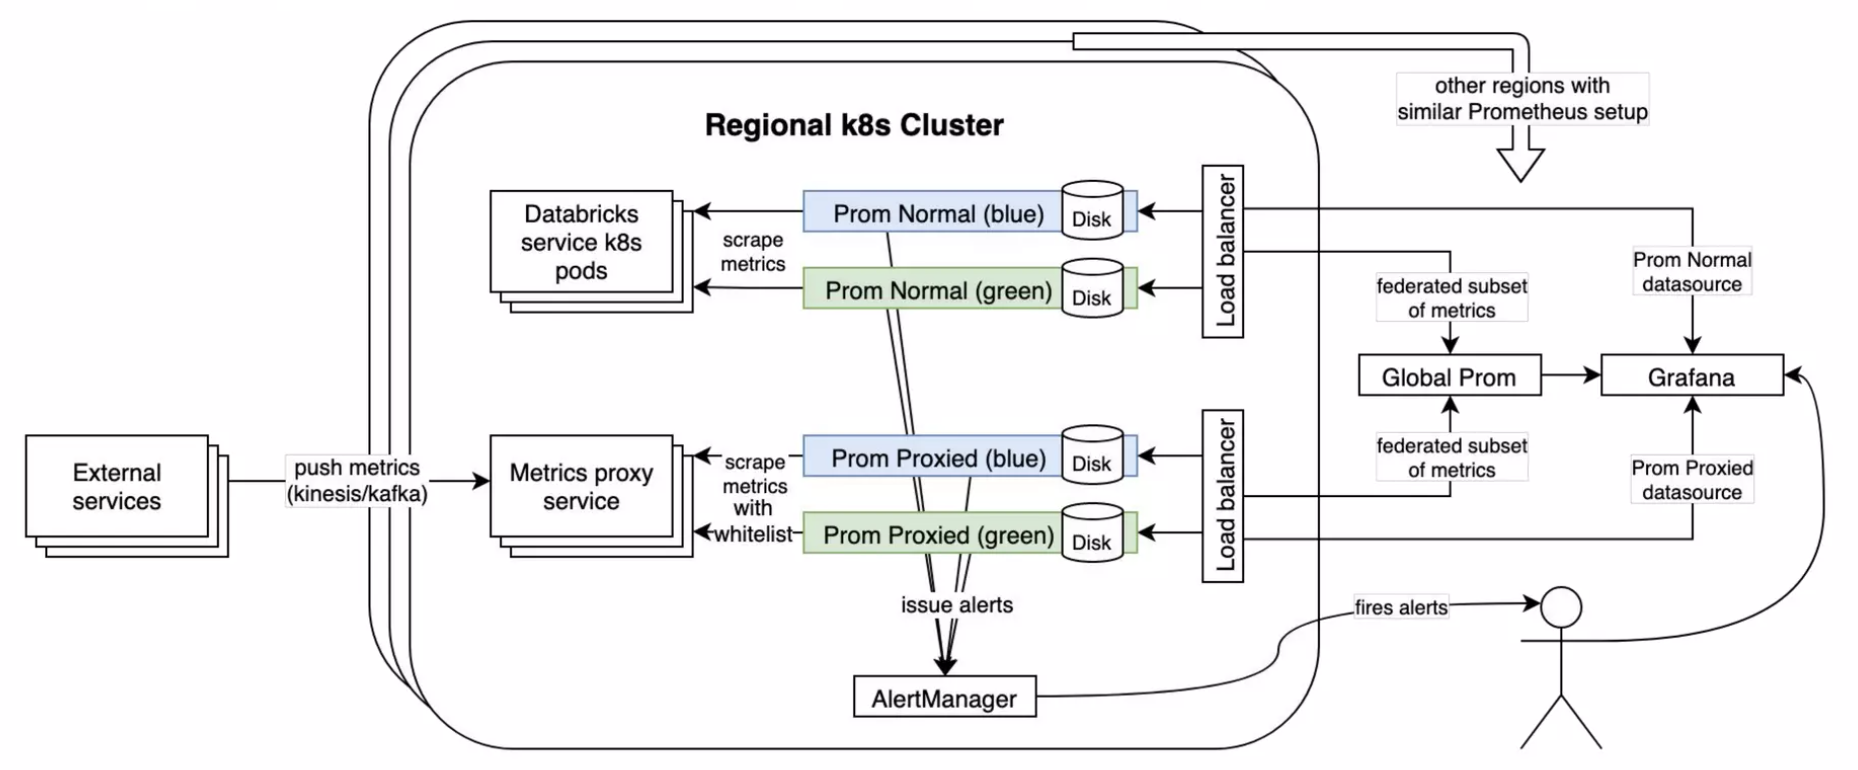
In each region, there are two Prometheus servers, Prom-Normal and Prom-Proxied. Prom-Normal scrapes metrics from internal services in k8s pods. Metrics from external services are pushed by Kafka to the Metrics Proxy Service (on k8s). Prom-Proxied scrapes metrics from the Metrics Proxy Service. Having two servers also means metrics can be sharded logically (internal/external) as all the metrics would not fit on one. Disks are attached to each Prometheus server to store metrics.
Globally, there is a Prometheus server that contain a subset of metrics federated from all the regions.
Users interact with the monitoring system in two ways: alerting and querying. Regional Prometheus servers issue alerts to the Alert Manager Service which notifies engineers via PagerDuty. Users also query regional or global servers for insights.
Problem
50 regions across multiple cloud providers with 4 million VMs of Databricks services and Spark workers.
- The global Prometheus server was huge. Disk usage of 4TB.
- Big queries not completing due to frequent OOMs.
- Short retention period, only 15 days.
- Users have sharded view of metrics (Prom-Normal, Prom-Proxied).
- Strict metrics whitelist to keep the servers running.
- Metrics are lost during restarts as it takes a while to replay the large volume of logs per server.
Requirements
Must:
- High metrics volume.
- 90 days retention.
- PromQL compatible.
- Global view of metrics.
- High availability setup.
Nice to have:
- Good maintenance story, no metrics gap.
- Open source.
- Battle tested.
Why M3?
Why M3 solves the problem for Databricks:
- Horizontally scalable.
- High availability with multi-replica setup.
- Exposes Prometheus API query endpoint.
- Global querying feature.
- Battle-tested at Uber production environment.
- Exists k8s operator for automated deployments.
M3 Architecture
1
2
3
4
5
Application --- M3 collector
                    |
                M3 aggregator
                    |
                  M3DB --- M3 query --- Grafana
- M3DB is a distributed time-series database, optimizations include time series compression. Sharding is also in-built.
- M3 Query is a stateless query server that accepts M3QL or PromQL. Coordinates with servers in other regions to achieve global queries.
- M3 Coordinator provides APIs to read and writing to M3DB. It also acts as a bridge with Prometheus.
- M3 Aggregator provides streaming aggregation of time series data. It reduces cardinality and/or datapoint resolution to reduce the volume of data stored.
Initial Plan
Prom-Normal and Prom-Proxied remote-write data in M3DB instead of local disks.
- For regional query, users only need to interact with regional M3DB instead of thinking about sharded view of Prom-Normal and Prom-Proxied metrics.
- M3 Query server would also provide global view without requiring another global Prometheus server.
- Least amount of work.
However, remote-writes by only two Prometheus servers could not achieved at a scale that Databricks required.
Small Components to Replace Prom-Normal and Prom-Proxied
More servers would achieve higher write throughput into M3DB.
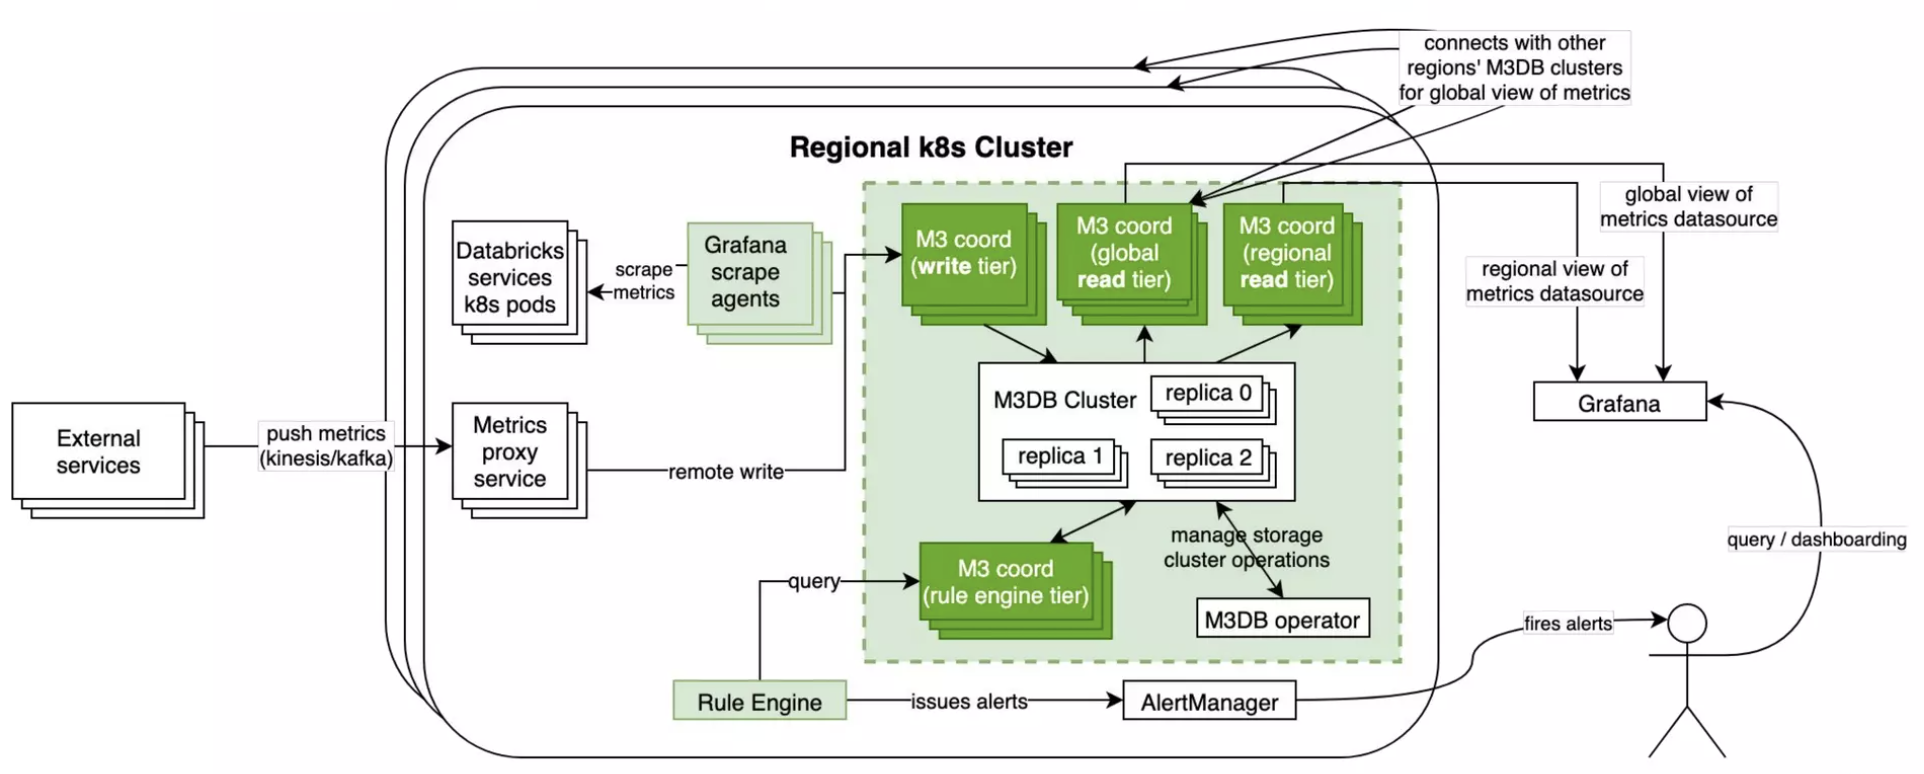
To replace Prom-Normal, multiple Grafana Scrape Agents scrape metrics from internal services and write to M3DB.
To replace Prom-Proxied, Metrics Proxy Service directly writes to M3DB. Note that this service is already made up of multiple servers. This reduces end-to-end latency of external metrics too.
Update Alerting
Originally, the alerting rule configurations are used in Prometheus servers to issue alerts to Alert Manager Service.
Databricks built its own rule engine that takes the same configurations and interacts with M3DB and Alert Manager Service.
Noisy Neighbor Issues
M3 Coordinators were having noisy neighbor issues. If users submit heavy queries, the coordinators would not be able to serve the write paths from Metrics Proxy Service and Grafana Scrape Agents.
To solve this, M3 Coordinators were separately deployed for read and writes. CPU-heavy machines for write-coordinators and Memory-heavy machines for read-coordinators.
Monitoring the M3 Monitoring System
Vanilla Prometheus servers that scrape M3 related components. Metrics retention period is short but it is sufficient for the use case.
Global Prometheus server to federate metrics for all the Prometheus server.
Final Architecture